Today we bring you a preview of our Sales Development 2016 report. We collected and analyzed survey data submitted by 355 B2B companies covering just about every aspect you’d ever want to know about a modern, high-performing sales operation.
The numbers illustrating various aspects of Sales Development are at times fascinating, encouraging, surprising, and even alarming in some cases. Whatever your overall impression about the direction of the data, we believe the possible applications for it are virtually endless.
New in this year’s report is something we like to call the Pipeline Power Score, referred to hereafter as PPS. Click here to learn more about how we calculated the PPS.
Mind you, this is just a preview. Our team made its own interpretations of different data points and offer suggestions for how to take this information and use it to grow as an organization. We encourage you to take a look at the full report, but first we’d like to share a few can’t-miss highlights.
Let’s dive right in, shall we?
Required Experience Hits All Time Low
Demand for candidates has risen since 2010. Average required experience is now just 1.3 years, a staggering 18% rate of annual decline since 2009.
[Tweet “Average required experience is now just 1.3 years, an 18% annual rate of decline since 2009.”]
Not unexpectedly, required experience rises with a company’s average sale price. Complex solutions require complex conversations. Even with the downward trend, it still takes time and experience to achieve comfort selling at that level.
Worth noting: Groups that require 2+ years experience scored a 12% higher average PPS.
We can’t help but think this is a rather difficult thing to achieve in today’s growing market. SDRs with 2+ years experience and an interest remaining within the SDR role will always be smaller than the pool of green candidates. Rep retention and experience will be a key ingredient for many organization in the future which leads us to our next topic.
Average Tenure is Down Sharply
Tenure has reached an all time low of 1.4 years on average. Only 5% of reps stay on board for 3+ years compared to 38% in 2009.
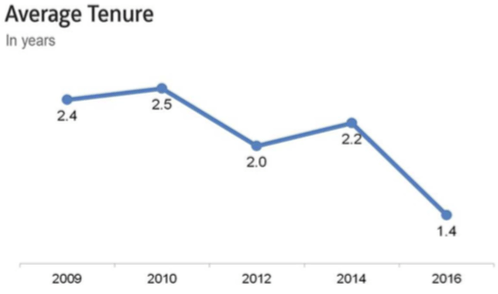
This trend significantly impacts the key metric of months at full productivity (tenure minus ramp time). Average months at full productivity is now just 14.
Career Path Matters
We’ve discovered three types of promotion tracks:
- Step Promotions (Junior SDR, Associate SDR, Senior SDR)
- Promotion across teams (Inbound, Outbound, Enterprise)
- Intro a quota-carrying role (SDR to AE, etc.)
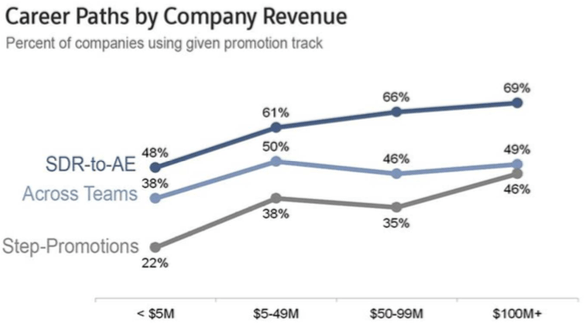
Defined career paths have a 2% average higher PPS. But companies with step promotions had 6% higher PPS.
Interestingly, companies with a defined SDR-AE path fared worse with a 9% average lower PPS. My take on this metric, we are rushing our SDRs into an AE role with little to no preparation.
[Tweet “We are rushing our SDRs into an AE role with little to no preparation. @bridgegroupinc”]
This is critical information worth exploring as a sales org. Clearly, the type of promotion track your company decides to go with matters, but to what extent and why?
Monthly Quotas Are Up
Quotas are 27% higher than in 2014. But these vary widely. Quota for an outbound SDR with an ASP of $100K+ went as low as 3 opportunities per month. 68% of reps in a given group are hitting quota.
Average Dials and Conversations Down Slightly
We found an average of 46 dials per day with actual quality conversations per day coming in at 5.8. The percentage breakdown of email-centric or phone-centric teams was about 50-50. However, in a win for all the stalwart defenders of dialing, phone-centric teams reported 26% more quality conversations per day.
[Tweet “We found an average of 46 dials per day with actual quality conversations per day coming in at 5.8.”]

There was no statistically significant variation of PPS between phone-centric or email-centric groups, but those who averaged 7 or more quality conversations per day had a 17% higher PPS. Bumping up the 46 dial per day average to achieve that 7+ quality conversations could prove to be a worthwhile endeavor for teams with the capability.
More Attempts Per Prospect Up 46% since 2012
SDRs on average make 8.2 attempts per prospect. Companies making nine or more attempts per prospect saw a 16% higher average PPS.
All that great content floating around about the effectiveness of late-round touches seems to be being heeded by sales teams, and it’s paying off according to our data.
So there you have it, a small sampling of the treasure trove of great insights we discovered throughout our research. What interpretations do you have about our current data and what did we overlook that we should try to include next time? Be sure to check out the full report and give us any feedback you have.


