As you read this, your salespeople are making decisions on how to spend their time.
Are you arming them with the insights to know if they’re making the right decisions? Think about it this way: Have you ever seen a salesperson who is always busy, but doesn’t seem to close much business? The fact is, they’re busy on the wrong things.
One way to ensure your sales reps are focused on the right behaviors is to define, track, and monitor your sales key performance indicators (KPIs). They help salespeople understand what activities they need to be carrying out on a day-to-day basis that will guide them towards their sales goals, and show sales leaders where reps are spending their time so they can provide objective, metrics-driven coaching.
The benefits of defining your KPIs are clear and proven. They result in better decisions, better execution, and better coaching, so what’s stopping you from having them?
Defining effective sales KPIs can feel like an intimidating process because you’re putting a stake in the ground on how you want your salespeople to focus their time. And since KPIs need to be specific to your own team, you can’t just blindly copy the same KPIs that other organizations are using.
[Tweet “You can’t just blindly copy the same KPIs that other organizations are using. @bobmarsh5”]
Instead, here’s a four-step process to define your own sales KPIs:
1. Understand what makes an effective KPI
First, your team needs to be on the same page about what exactly a key performance indicator is. You know a key performance indicator is a measurement of success against your business objectives. But what does that really mean?
The key word here is “indicator.” Your KPIs should be an indication for what the future holds.
[Tweet “Your KPIs should be an indication for what the future holds. @bobmarsh5”]
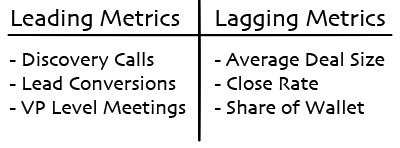
That’s why KPIs should be focused on leading indicators, and NOT lagging metrics. Leading indicators measure what is happening right now, while lagging metrics show what has already happened.

[Tweet “KPIs should be focused on leading indicators, and NOT lagging metrics. @bobmarsh5”]
KPIs that are leading are controllable behaviors for your salesperson–actions that you can monitor in real time, and adjust accordingly if you start to fall behind pace. Lagging metrics, like average deal size are insightful and very important to monitor, but they won’t affect your sales team’s day-to-day activities and the decisions they make on how to spend their time.
2. Map Out Your Sales Process
Once you and your team understand what effective KPIs are, you can start to define your own. KPIs are unique to every company, team and role. They will depend entirely on your unique sales process.
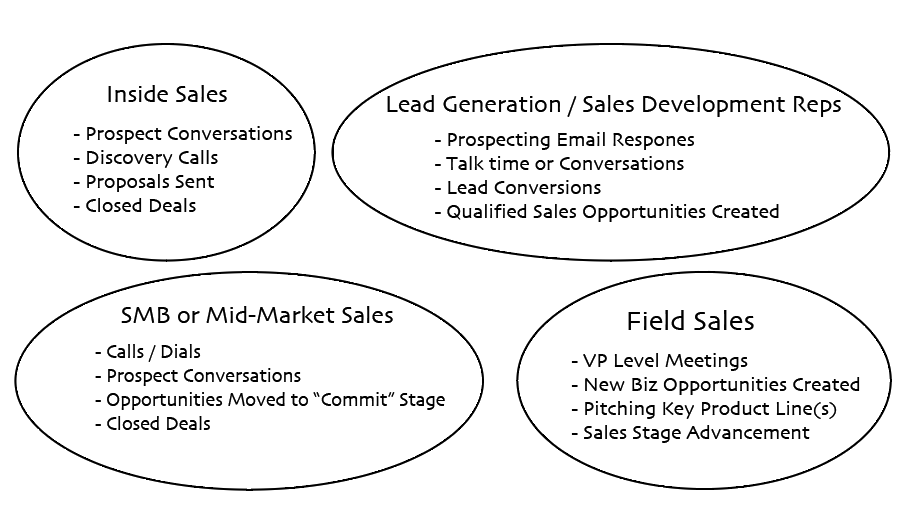
Ask yourself and your sales team what activities are truly meaningful to the sales process. Pick out 3-4 actions your sales reps perform that move a prospect through the pipeline. Does your sales process require face-to-face meetings? That’s a KPI. What about qualifying leads? That’s a KPI, too.
Here a few examples of different KPIs for various sales roles:

The goal of this exercise is to be able to map your organization’s sales process. So you’ll end up with something like this:
![]()
Those actions that move prospects through the sales process are your KPIs.
3. Reverse Engineer Your Sales Forecast
This next part is critical. You have your KPI activities, now look through your historical data. Determine how much of each activity it takes to get to the next step of each process.
In other words, calculate the average number of proposals you need to send out to get one closed deal. If you know that you usually get one closed deal for every four proposals you send out, then your conversion rate is 25 percent.
You already have your sales goal for the month, quarter or year. Now take that number and work backwards through your sales process to define how many of each activity will get you there.
Let’s say your sales goal is $1 million, and you have a lagging metric that tells you your average deal size is $100,000. That means you’ll need ten deals to get to your sales goal.
![]()
This is how you’ll figure out the goal for the last KPI in your process. In our example, the sales team must close ten deals to bring in $1 million. This might sound simplistic, but far too many people don’t go through this basic process. Let’s keep going…
4. Calculate Activities Needed To Get To Revenue Goal
The last step is to calculate the number of activities needed for each step of the process leading up to the final goal. Repeat the steps above for each of your KPI activities (divide the goal metric by the conversion rate to determine how much of the preceding activity is needed).
Following with our previous example, we’d start with the 10 demos. Since we know there’s a 25% conversion rate, we divide the 10 demos by .25 to find that we would need to conduct 40 discovery calls.
![]()
If we assume a 25 percent conversion rate for each part of the process, we’d end up with a final result looking like this:
![]()
Now you know how much of each individual activity your team needs to perform to reach your sales goal. Congrats! Those metrics are your sales KPIs.
Don’t forget to get early buy-in from your salespeople, create visibility around KPIs and revise, rewrite and reboot when needed.


